Country Profile
This module gives a broad overview of how well a country is managing the environmental impacts caused by its consumption and production processes. Charts and graphs show a country’s evolution across four key areas: material use, climate change, air pollution & health and land use. Users can hover over images for additional information. It provides the key information regarding the country’s environmental performance, in the context of the most relevant SCP-related policy questions. The target users are policy makers, NGOs and the general public.
Analysis indicators
Country’s evolution across key areas is analyzed and reported: material use (material footprint/capita tonnes/capita) climate change, air pollution water pollution and related ecosystem impacts & health and land use.
The main challenge addressed by SCP-HAT was the identification of strategic priorities on which the Sustainable Strategy of Argentina should focus. The tool was used as a guide to ensure that efforts and policies would first and foremost tackle socio-economic sectors or activities that lead to the greatest impacts.
Training of the SCP-HAT tool was delivered to UN Country Team of Argentina and the national government.
The tool was used as a methodological guide to design the country´s SCP strategy, “Methodological criteria to select the strategic priorities”. It enabled a large-scale analysis and gave an overview of the general socio-economic trends in Argentina from 1990 to 2018.
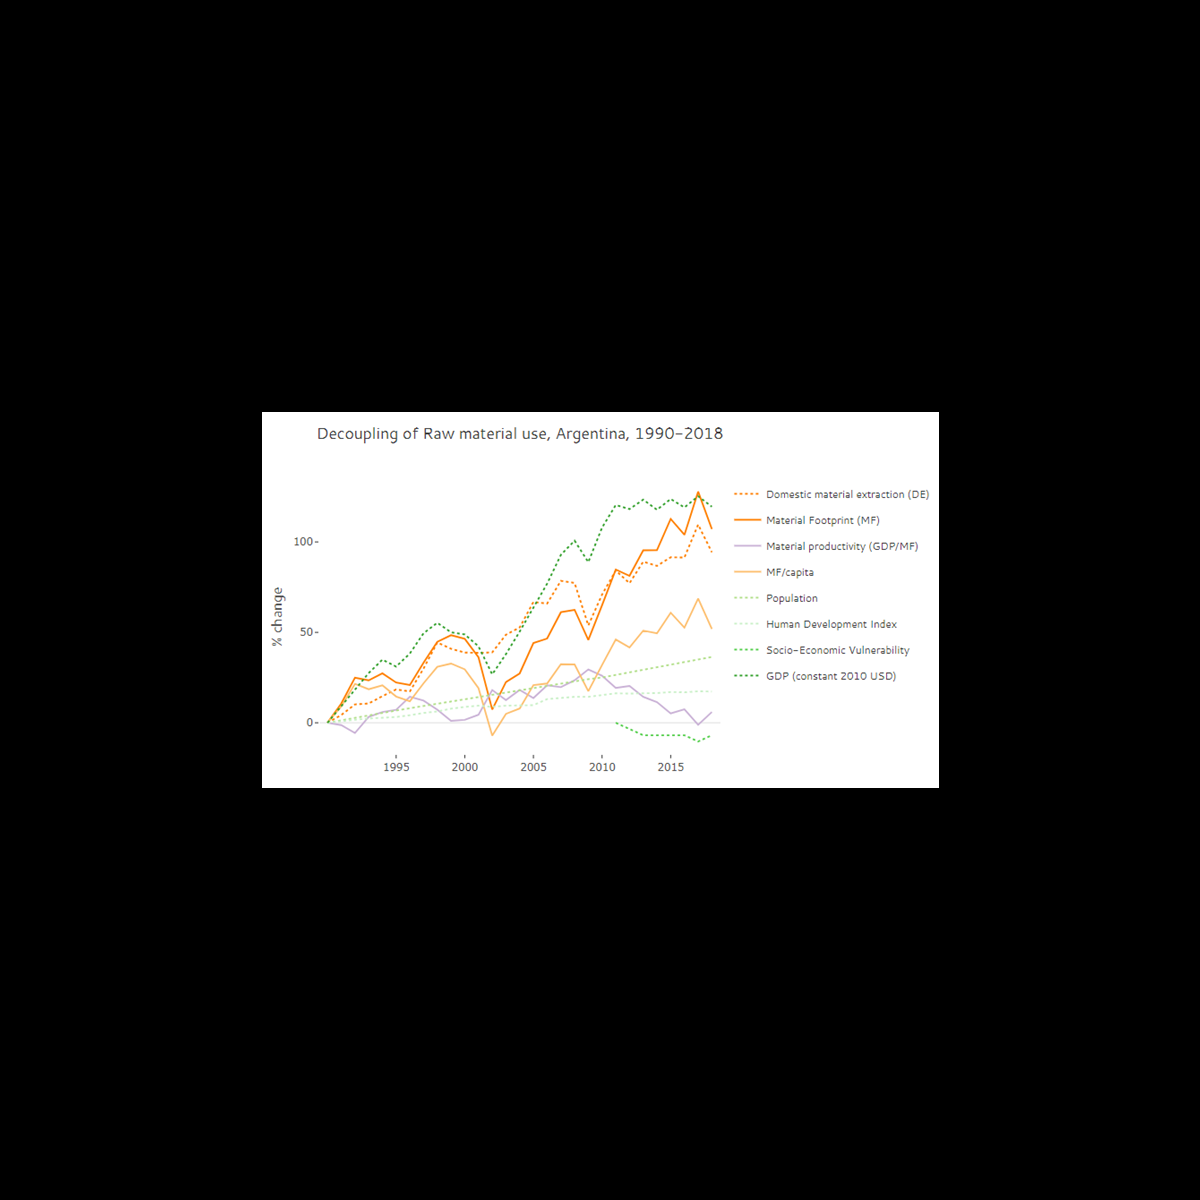
The tool is maintained and updated overtime. It was overall identified that the material footprint of Argentina increased by 107.1 % from 1990 to 2018. At the same time, GDP increased by 119.5 %. Hence, material productivity, measured.
Report generation of sustainability trends
Each key area shows sustainability trends (from 1990 to latest year of analysis) When evaluating trends in decoupling water, land, carbon, and energy footprints from economic performance, two types of decoupling can be distinguished: a) Relative decoupling is achieved when economic growth is exceeding growth consumption along supply chains. b) Absolute decoupling. In contrast, achieving economic growth while at the same time decreasing the consumption is called absolute decoupling. While both cases entail an increase in efficiency, only the latter can be seen as a means towards lowering the pressures on human beings and ecosystems.
The SCP-HAT allowed the examination of decoupling trends, such as how raw material use evolved in relation to GDP growth during this period. A slight progress in relative decoupling was noticed and the possibility to adopt both the consumption and production perspectives was also deemed useful.
Report trade in raw materials
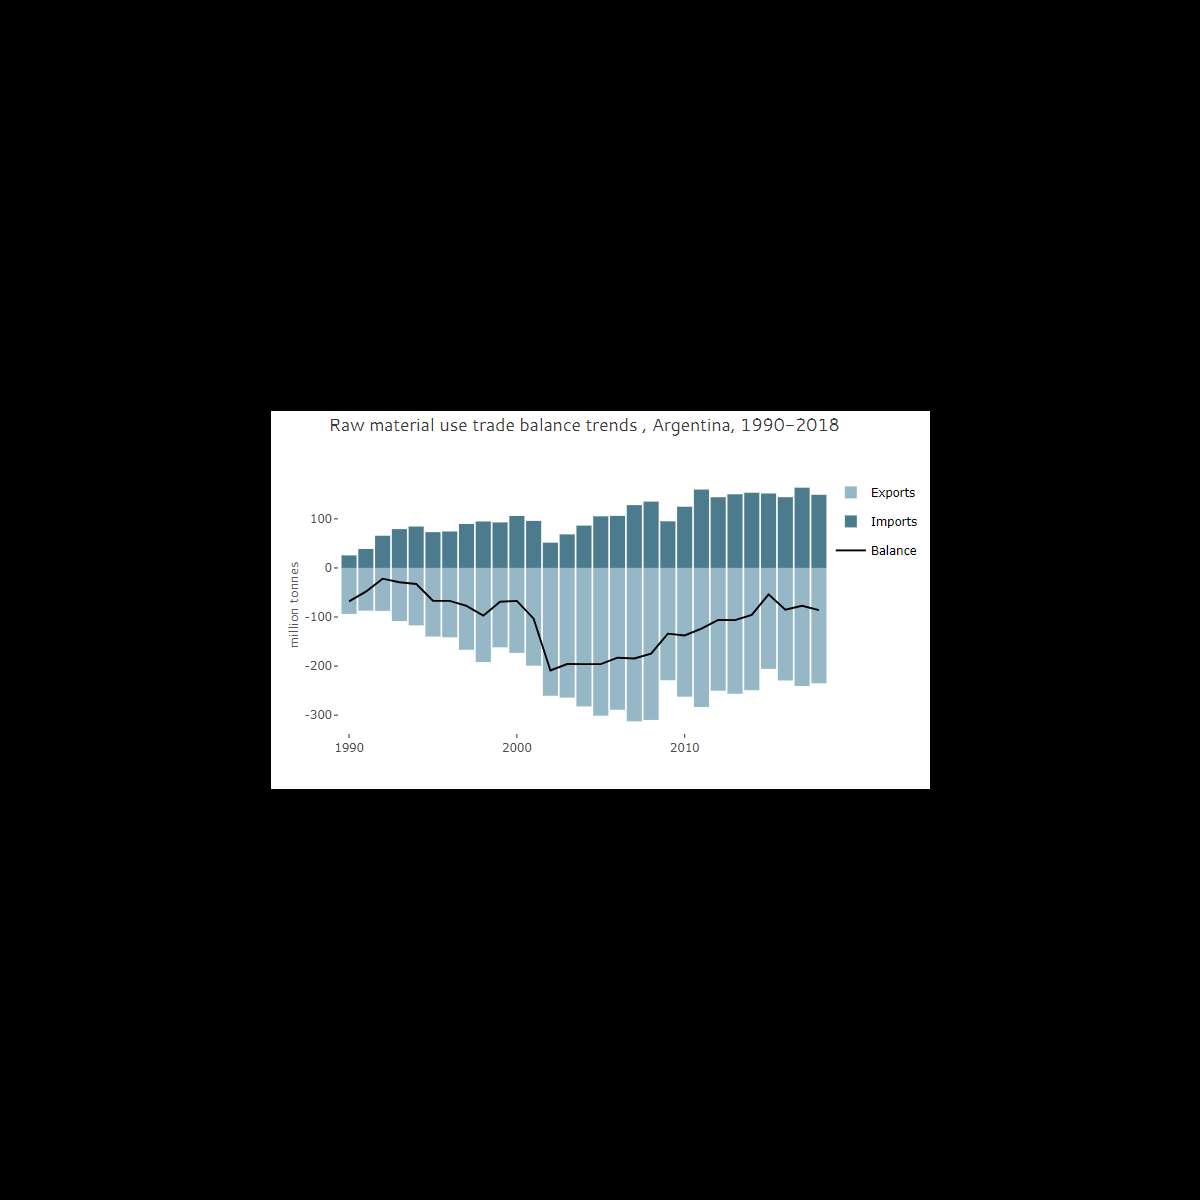
All semi-finished and finished goods imported into or exported by a country contain indirect raw material flows – those raw materials that are used as inputs along international supply chains. By comparing the indirect flows associated with trade flows it can be assessed if a country is a net-importer (imports exceed exports) or net-exporter (exports exceed imports) of raw materials. Indirect imports contain all raw materials extracted abroad to produce goods and services consumed in the country of interest. Indirect exports contain the raw materials extracted domestically for the production of exported goods and services. Imports, which are re-exported, are not included in the imports nor in the exports.
The country´s Strategy highlights that the tool enabled to check the coherence of production and consumption patterns within the economy. For example, since Argentina exports significant amounts of raw materials, it is logical that domestic extraction is greater than the demand.
Country comparison
In this section a comparison of 164 countries of the world is shown, and the rank of the selected country. This comparison is conducted for each of the indicators (material use, GHG emissions, land use, water use, energy use and water pollution) Material footprint: Carbon footprint: The lower the per-capita carbon footprint of a country, the lower the pressure exerted globally on the environment through the consumption of goods and services in the country.. A lower rank means lower per-capita carbon footprint.
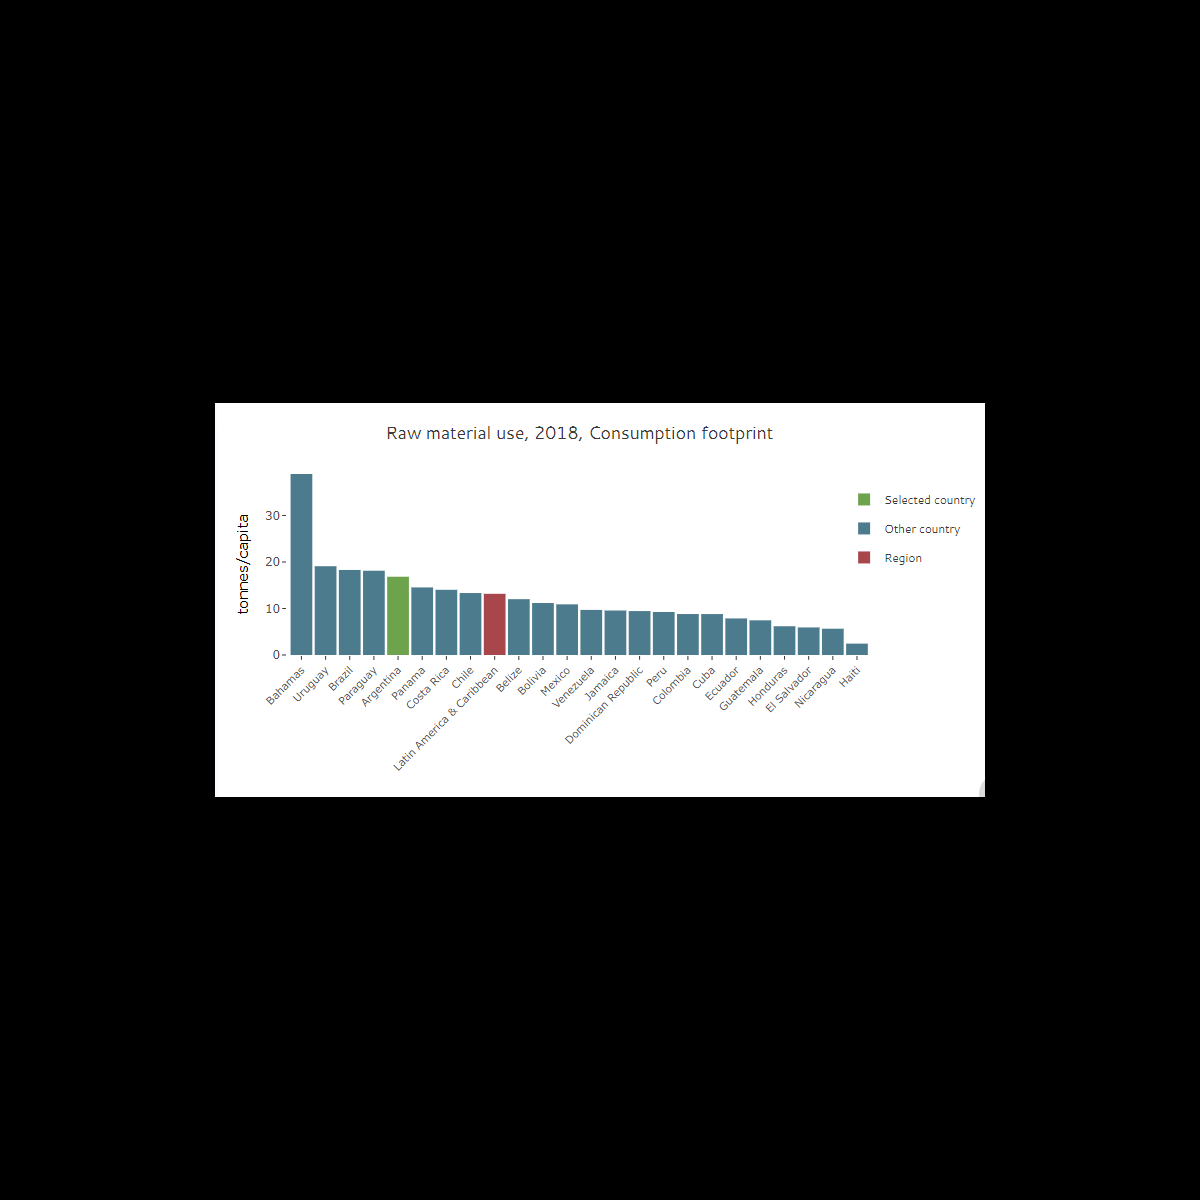
By benchmarking Argentina’s performance with other countries, the following was concluded: Material footprint: The comparison of the per-capita material footprint of Argentina (16.8 tonnes per capita) with other countries in the region shows that Argentina ranked 19., 27.9 % above the regional average of 13.2 tonnes per capita.
Carbon footprint: Via its international trade relations, Argentina is responsible for GHG emissions in almost all countries in the world. The sum of all these GHG emissions caused by final consumption in Argentina is called “carbon footprint”. The carbon footprint of Argentina increased by 34.8% from 1990 to 2018.
Pollution footprint: Argentina is responsible for air pollution impacts in almost all countries in the world via its international trade relations. The sum of all these air pollution impacts caused by final consumption in Argentina is called “air pollution footprint”. The air pollution footprint of Argentina increased by 149.1 % from 1990 to 2018.


