Hotspot Identification
Module 2 includes a wide range of SCP indicators from a consumption footprint perspective and domestic production perspective, to analyse hotspots of unsustainable consumption and production at country and sector levels. Results help to identify areas where political action is needed.
This includes the following sub-steps:
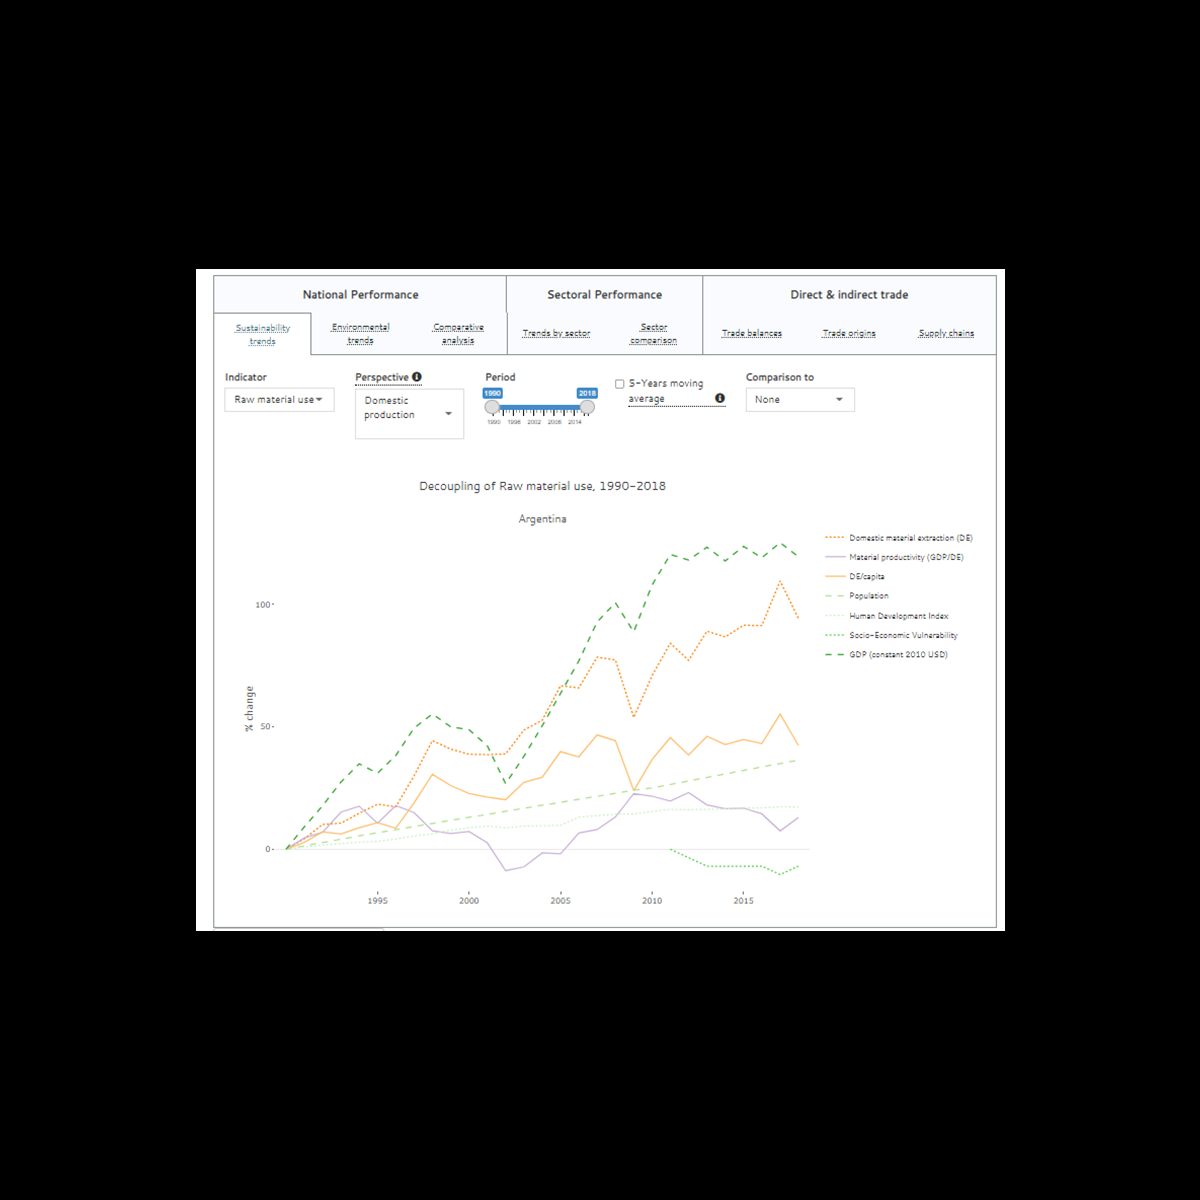
- Sustainability trends: This information allows to see if the country in question has achieved to decouple its development (measured as GDP and HDI) from environmental pressures and impacts. Analyses can be done for the perspective of domestic production as well as for the supply-chain wide consumption footprint. It also compares the country’s performance with other countries of interest.
- Environmental trends: This information helps to explore the development of environmental pressures and impacts both in a specific country (domestic production) as well as along the supply chains of the goods consumed within the country (consumption footprint) and compare the country’s performance with other countries of interest.
- Comparative analysis: This section assesses a selected country regarding the development of environmental pressures and impacts, both from the domestic production and from the consumption footprint perspective, in comparisons with other countries grouped by geographical regions or socio-economic characteristics
The strategy relied on the SCP-HAT to build visualization graphs and analysis across sectors, which notably highlighted the importance to address impacts with regards to food systems (including agriculture) when developing the strategy.
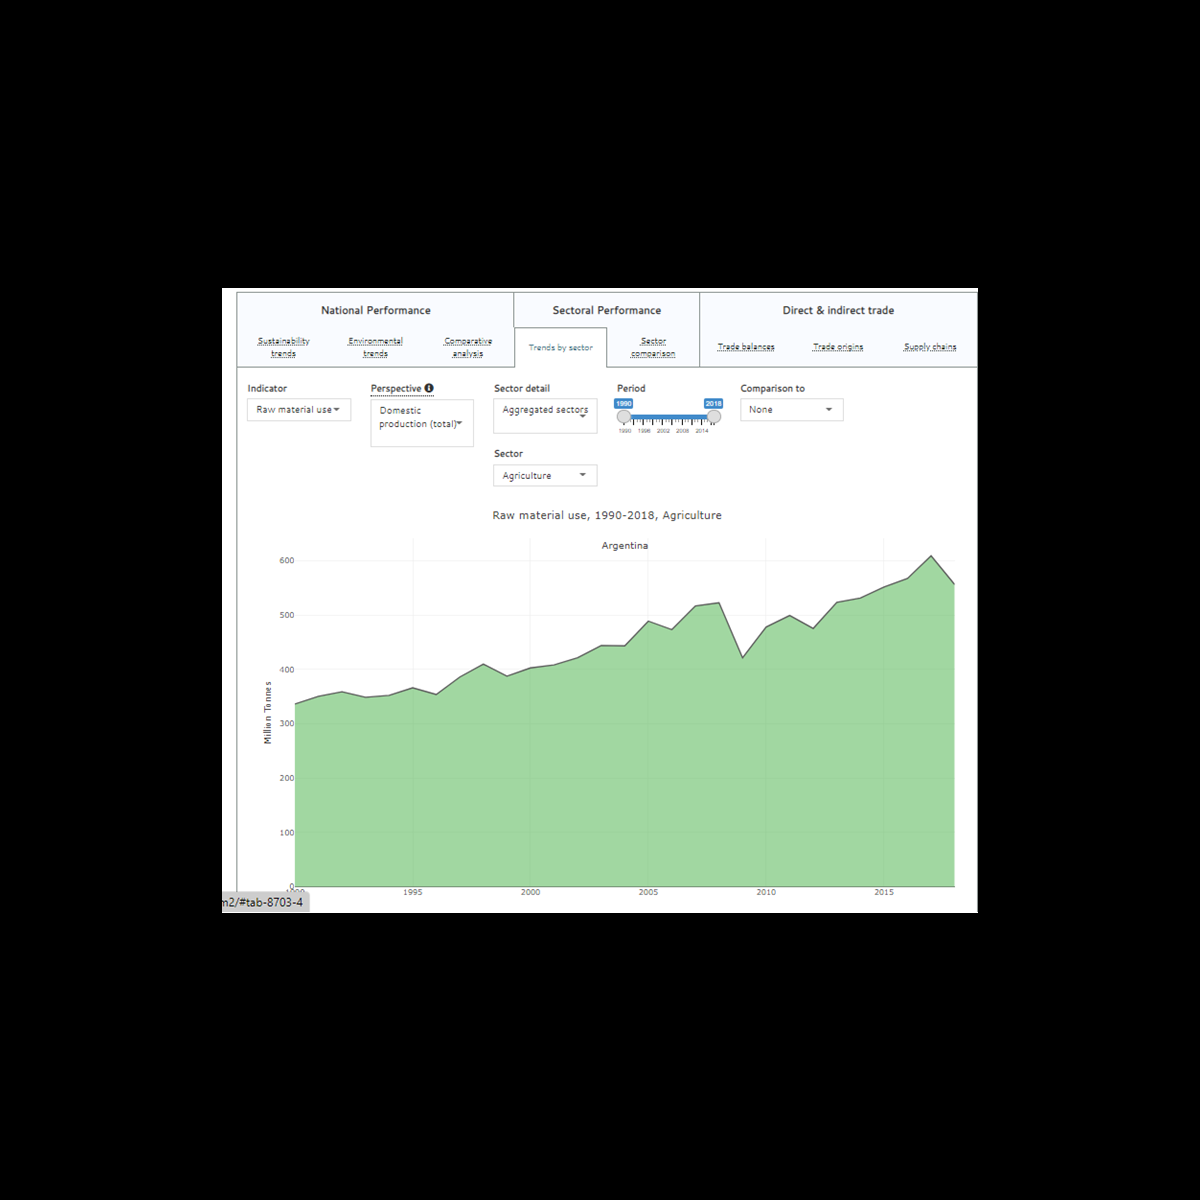
From the domestic production perspective, in 2018, the sector contributing most to material use in Argentina was Agriculture (67 %). Also, agriculture was the sector contributing to most GHG emissions, air pollution and land use (42 %), (49 %), and (77 %) respectively. In contrast, applying the consumption footprint perspective, the material footprint was dominated by products delivered to final demand by the Food sector (35 %). With 27 %, the Food sector was the hotspot sector with regard to the carbon footprint, while the sector Agriculture was the hotspot for the air pollution footprint (19 %), and Food for the land use footprint (51 %).
This includes the following sub-steps:
- Trends by sector: This section analyses specific sectors of the country of interest with respect to their performance regarding environmental pressures and impacts caused and the respective intensity levels. This can be done for both perspectives – domestic production as well as the supply-chain wide (consumption footprint) for the products supplied by each sector to final demand. The indicator "supply-chain employment" estimates the number of workers that proportionately were working along the supply chains of goods delivered to final demand. For more information on how sectors are aggregated, refer to the Technical Documentation available on Methods & Data.
- Sector comparison: With the selection of different environmental and socio-economic indicators, it is possible to compare the sectors of the country with regard to their performance, for both the domestic production perspective, as well as the perspective of the supply-chain wide footprint of the products supplied by each sector to final demand. For more information on how sectors are aggregated, please see the Technical Documentation available on Methods & Data.
The tool gave a strategic direction to design the SCP strategy of Argentina. It notably highlighted that the food systems were primarily responsible for the impacts of raw material use.
The SCP Strategy was therefore articulated accordingly to tackle this hotspot.
Direct & indirect trade
This includes the following sub-steps:
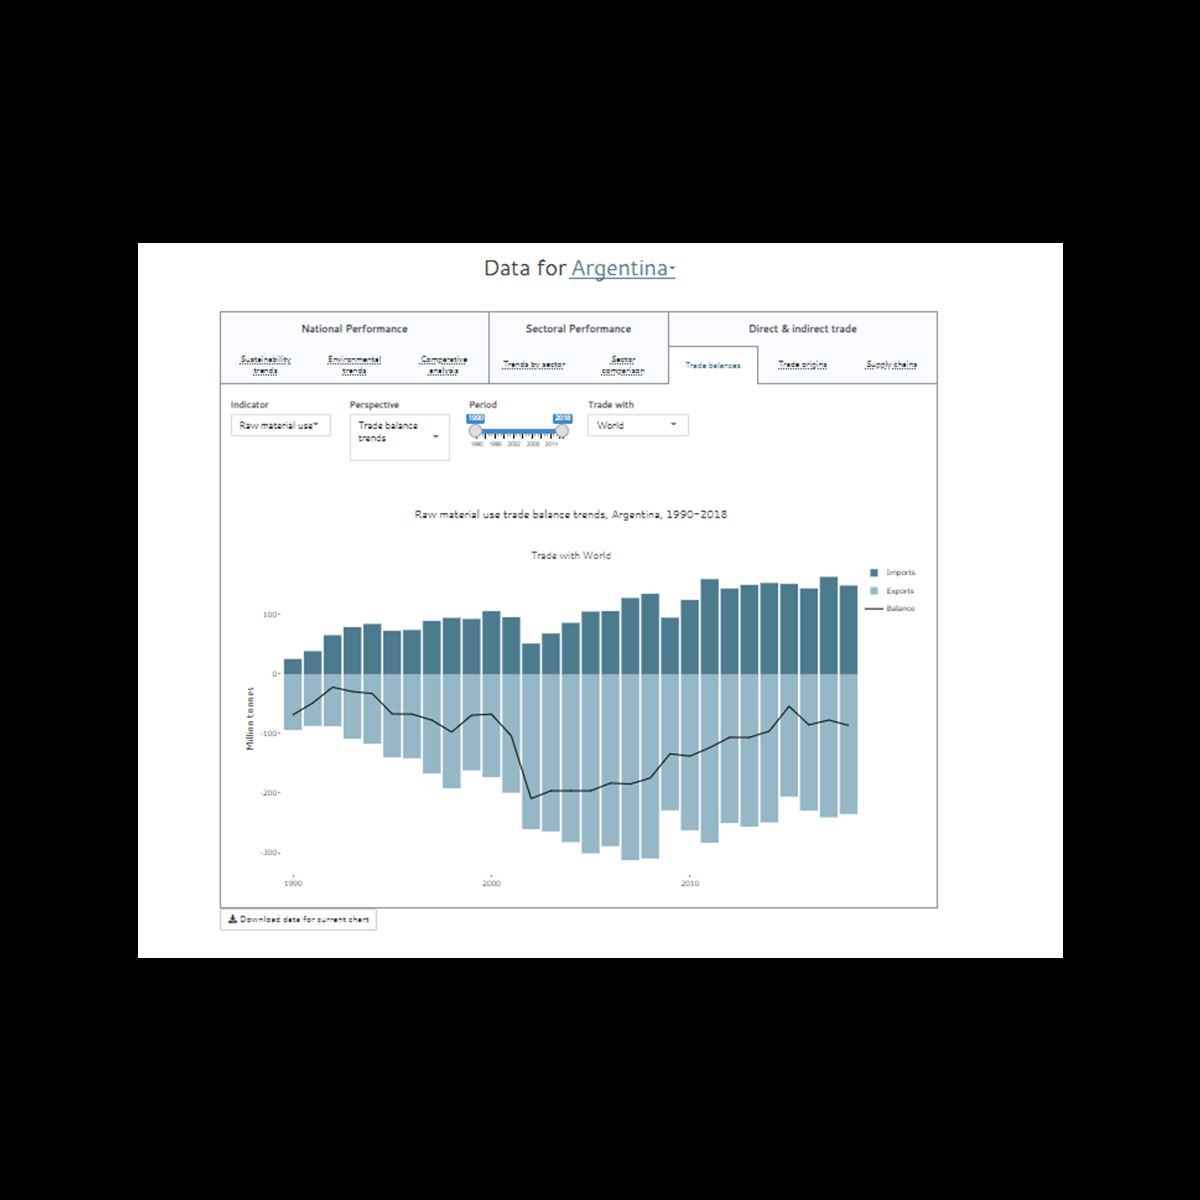
- Trade balances: This information helps to find out more about the pressures and impacts caused along the supply chains of imported and exported products of a country. They are compared to understand if the country is a net importer (imports > exports) or net exporter (exports > imports) of pressures and impacts. Indirect imports contain all pressures and impacts caused abroad to produce goods and services consumed in the country of interest. Indirect exports contain all pressures and impacts caused domestically for the production of exported goods and services. Imports, which are re-exported, are not included in the imports nor in the exports.
- Trade origins: This information allows to know more about a selected country’s dependency on foreign resources as well as about its contribution to others’ footprints. The consumption footprint of a country is made up of pressures and impacts caused domestically as well as abroad to produce the goods and services consumed in the country of interest. Indirect imports contain all pressures and impacts caused abroad to produce goods and services consumed in the country of interest. These pressures and impacts are "embodied" in the imports. Via indirect exports each country contributes to consumption footprints abroad. These indirect exports contain all pressures and impacts caused domestically for the production of exported goods and services. These pressures and impacts are "embodied" in the exports. Imports, which are re-exported, are not included in the imports nor in the exports.
- Supply chains: This visualisation identifies individual supply chains that link domestic pressures and impacts to final consumption elsewhere. For the perspective of domestic production, visualise the most relevant supply chains, via which environmental pressures or impacts related to production in the country contribute to the consumption footprint in different countries/regions. For the perspective of consumption footprint, visualise the most relevant supply chains, via which the selected country’s final demand is inducing environmental pressures or impacts related to production in different countries/regions.


